PIE chart samples
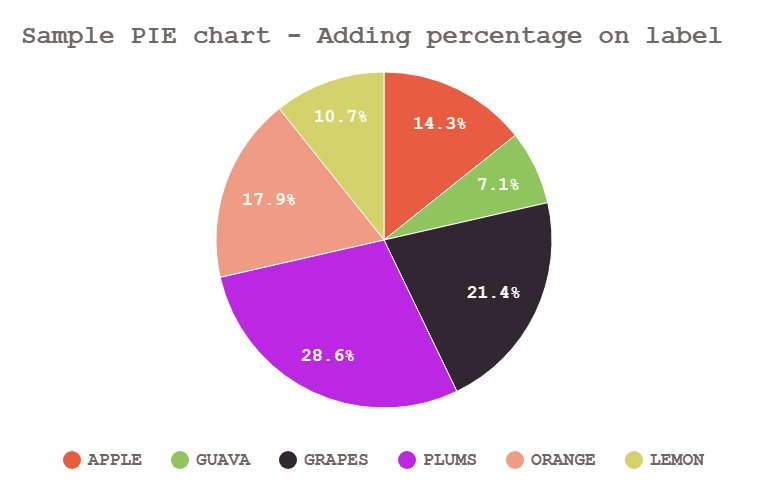
PIE chart - with percentage value
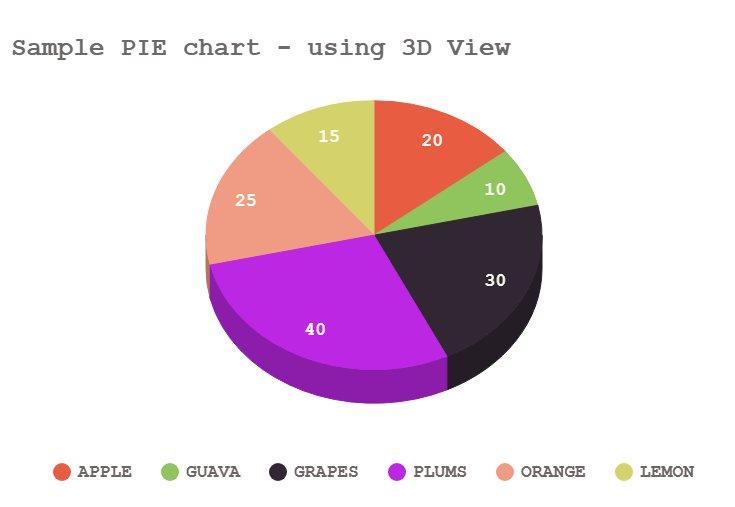
3D PIE chart
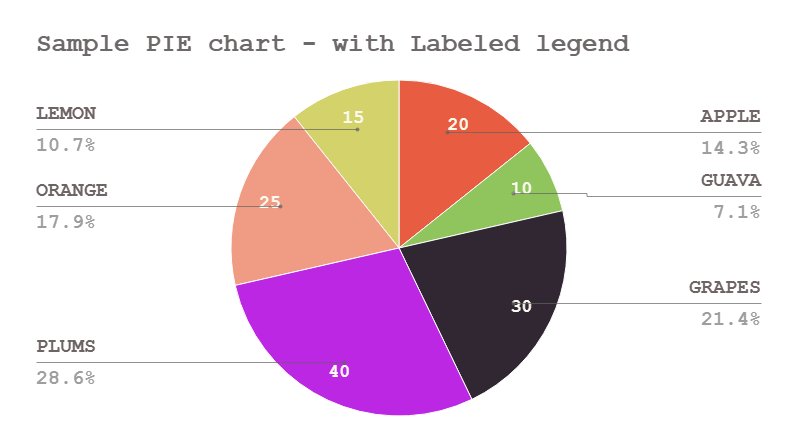
PIE chart - Labeled legend
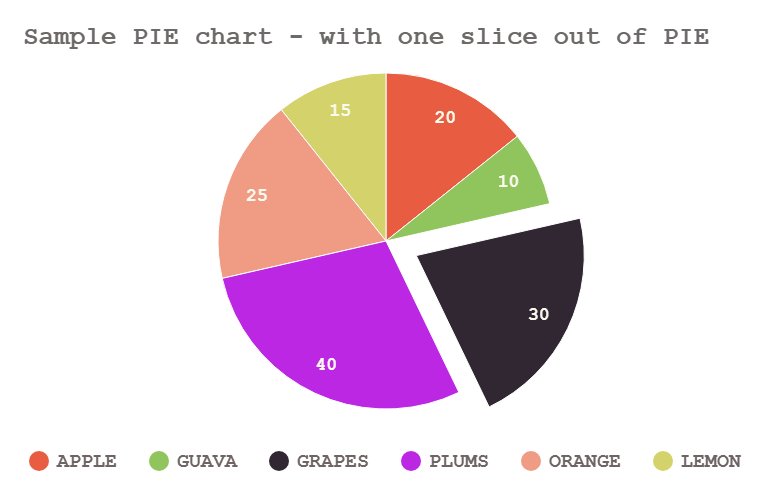
PIE chart - Slice out
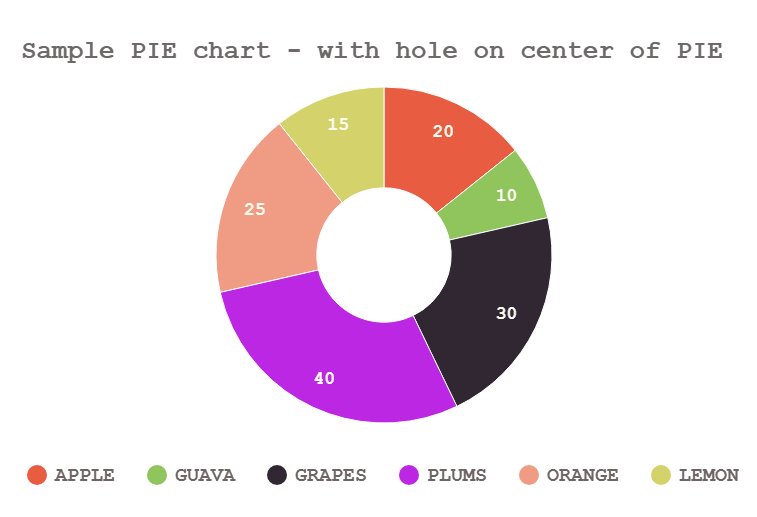
PIE chart - With Donut hole
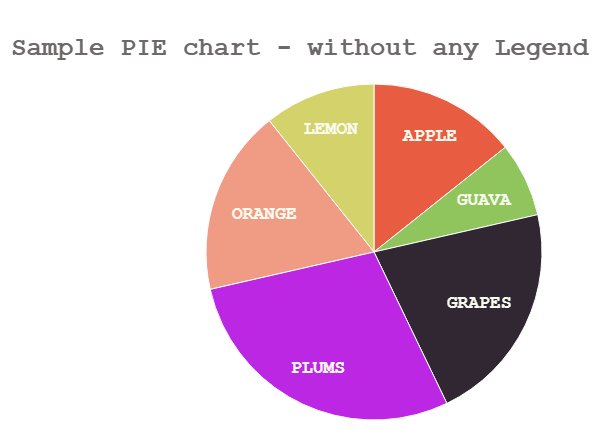
PIE chart - Without legend
Free online tool
pie chart preview
PIE chart samples
Description
Pie charts are circular graphs that visually represent how different categories contribute to a whole by dividing the circle into proportional slices. Each slice’s size corresponds to its share of the total, making it easy to compare parts at a glance. The entire circle represents 100%, with each slice depicting a distinct category or group. To help identify each segment, pie charts often include labels or a legend. They are especially effective for showing how a whole is distributed among several categories, offering a straightforward way to visualize proportions.
This tool enables easy creation of pie charts that can be saved in PNG, JPG, or SVG formats. Users can input data for each slice or segment, select distinct colors, and customize label fonts from a variety of styles. Additional features include slicing out individual segments, creating 3D or donut-shaped pie charts, and displaying a labeled legend for detailed slice information. The tool also offers options for CSV import and export, allowing quick data upload and seamless future reuse. The pie charts are rendered using the powerful Google Charts library, with all credit due to Google Charts.
What we do
This tool makes creating a pie chart simple—just input data for each slice or segment, pick a unique color for each one, preview the chart, and download the image.
This tool generates pie chart using powerful Google chart tools and it is rendered within the browser.
This tool lets you create unlimited pie charts without any restrictions or the need to register.
After creating your pie chart with the tool, choose your preferred image format and click the download button to save the chart as an image.
Creating a pie chart with this tool requires no special skills. Just enter the data for each slice, pick a different color for every slice, preview your pie chart, and then save it as an image.
This tool lets you create pie charts without any limits or the need to sign up. Enjoy complete freedom to make as many charts as you want, quickly and effortlessly.
Tools section