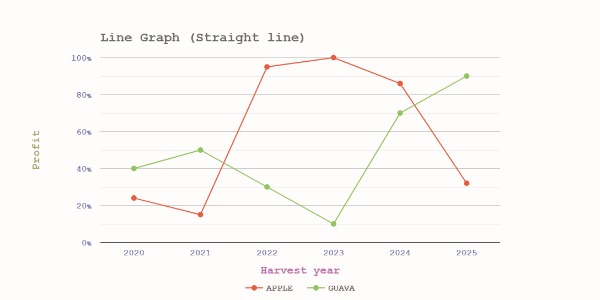
Line Graph samples
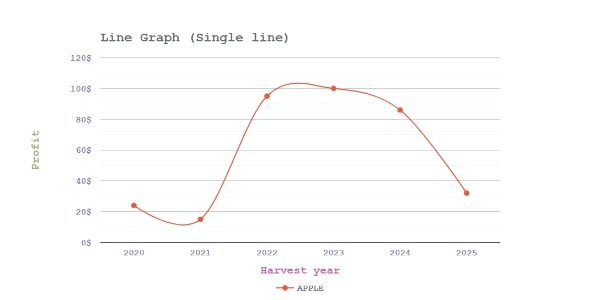
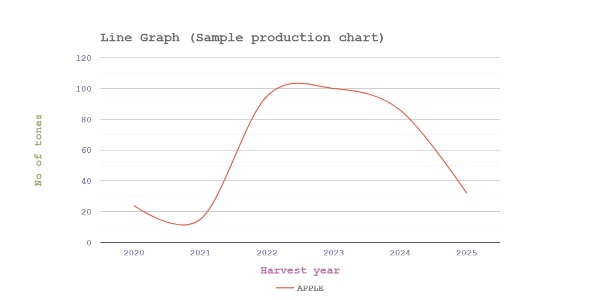
Single line chart - with curved line
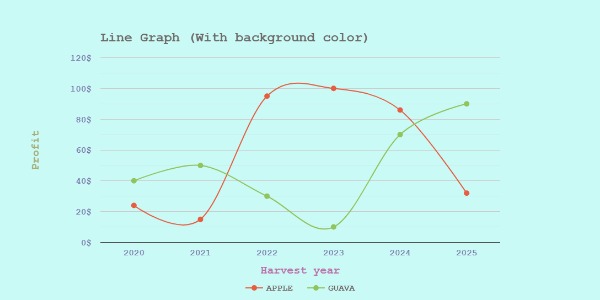
Line Graph with background color
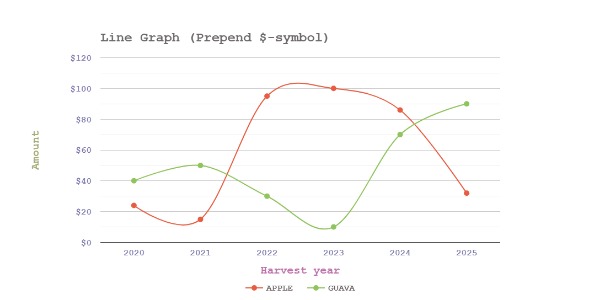
Line Graph - Prepend $ symbol
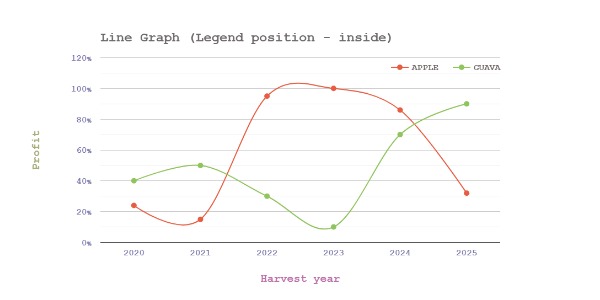
Line Graph - Legend position (inside chart)
Line Graph - hide point displayed on line
Line Graph - Ignore curved line function